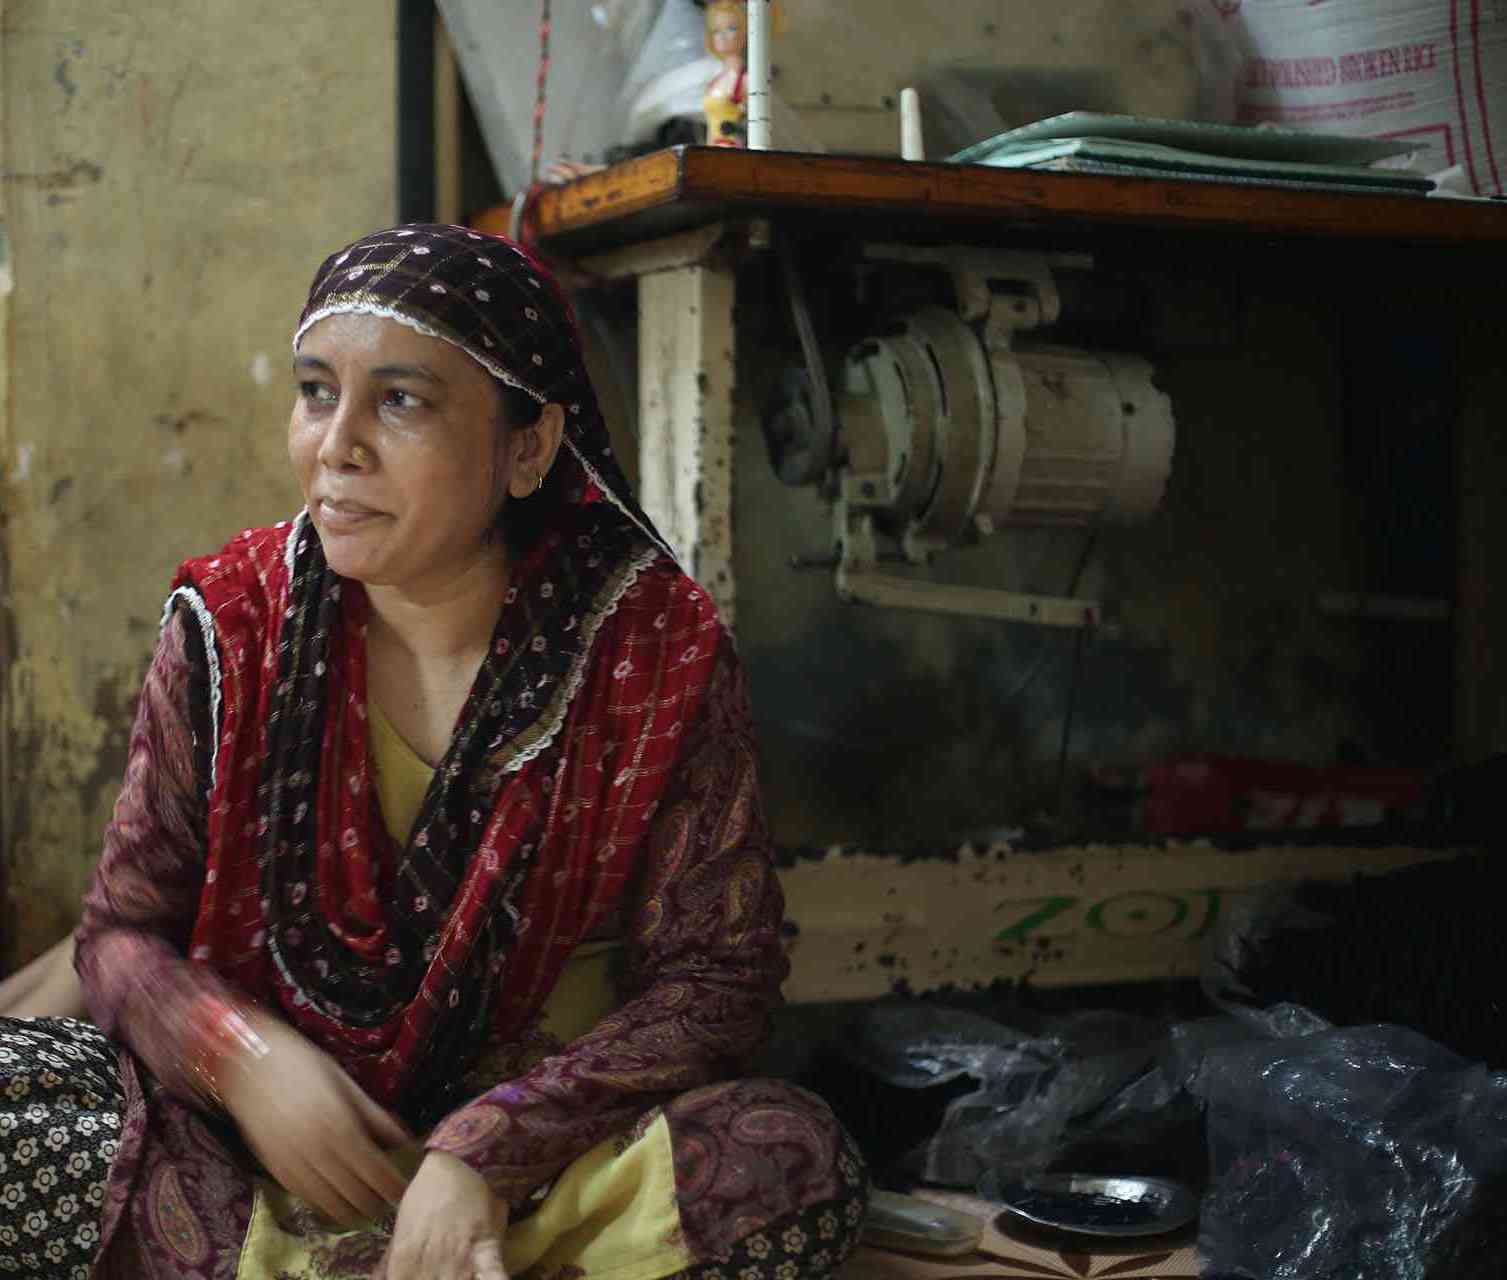
 The defining event of 2020 has been the COVID-19 pandemic. As countries struggled to deal with the pandemic, we also witnessed a never before seen near-global lockdown. Shivaji Nagar in M East Ward of Mumbai comprises some of the most marginalised communities of urban poor in the city, and the circumstances of this year have undoubtedly taken a heavy toll on them. The compounding of already existent inequalities and challenges of the urban poor has led to a disproportionate negative impact of the pandemic as compared to the city’s more fortunate residents.
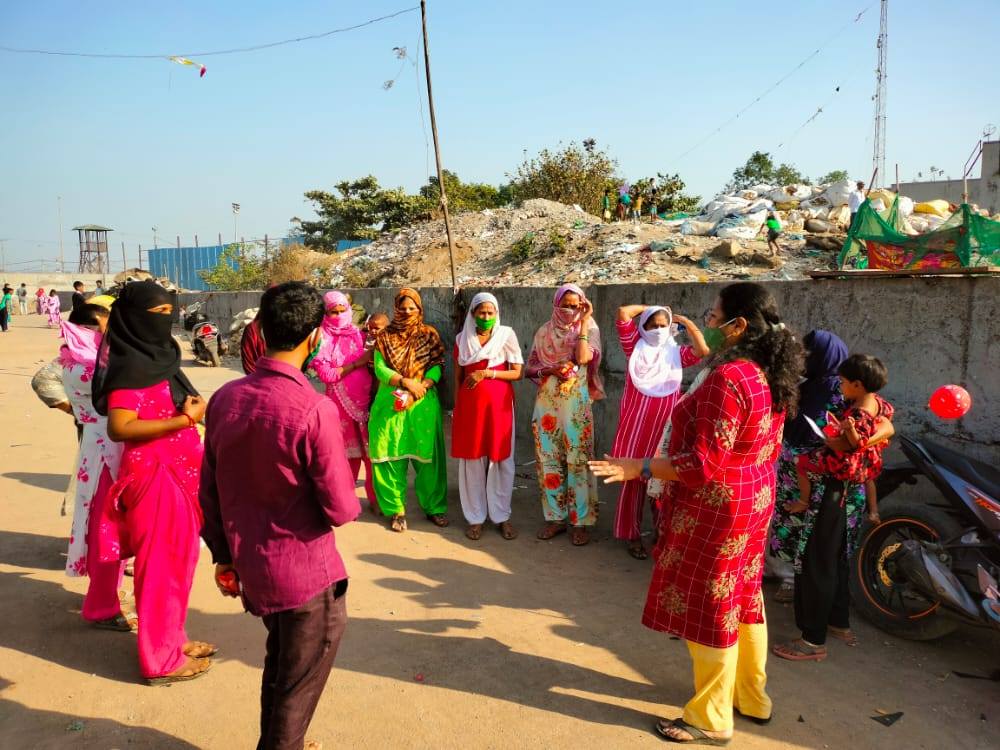
As an immediate measure, Apnalaya conducted a Rapid Needs Assessment among program participants in June, 2020 which provided initial insight into the situation of the community. As a result, we conducted a Community Needs Assessment aims to further investigate the situation and needs of the community in the areas of Livelihoods, Health and Nutrition, and Water and Sanitation between August and November 2020. Recognising the goal of better understanding the change in the community, we have compared our findings to those from the Apnalaya 2015 report – ‘Life on the Margin: Charting Realities’ (henceforth referred to as the ‘2015 Situational Analysis Report’) where ever possible. We see an improvement in multiple areas but a lot is yet to be done.
Below are some important findings from our report:
| Variable | 2015 | 2020 |
| Average Monthly income | Rs 7,802 | Rs 13,555 |
| Child Sex ratio | 942 | 813 |
| Individuals with entitlements | 84.7% – Aadhar card 76.6% – PAN card 62.9% – voter ID 64.4%- ration card |
96.9% – Aadhaar card 85.3% – PAN card 70.6%- voter ID 74.7%- ration card. |
| Female labour force participation rate | 13.7% | 7.1% |
| Literacy rate for females (ages 15-49) | 69.5%. | 82.6% |
| Literacy amongst males (age 15-49) | 78.2% | 93.6% |
| Females reporting no education or low levels of education (less than 5 years of education) | 50.8% | 37.8% |
| Males reporting no education or low levels of education (less than 5 years of education) | 43.1% | 27.4% |
| Daily expenditure on water-buying | 45% of families reported spending INR 30 or more | less than 10% with majority spending between INR 10-19 per day on water |
| Food (in)sufficiency | 46.5% of families ate only once or twice in a day | 16.5% of families ate only once or twice in a day |
| Food (in)security | 11.2% | 13.5% |
| Families going without food | 8.0% | 4.2% |
| Underweight Children | 47% | 34% |
| Stunting in Children | 58% | 47% |
| Institutional Birth | 94% | 98% |